
Summaries To Posters: IMRAD-Based Strategy for Teaching Scientific Paper Analysis
Marvin D. Hoffland, Carinthia University of Applied Sciences, Villach, Austria
Lecturers often face the challenge of how to get their students to read and analyze scientific papers in their Academic Writing courses. A standard method of ensuring that students have read the paper has been to require a written summary of the paper. This is usually a one-to-two-page synopsis of, on average, a journal article that is 10-15 pages. However, when an AI prompt can achieve this in a matter of seconds, this method appears to be outdated. I will describe a method that combines presenting the paper as well as creating an IMRAD (introduction, methods, results, analysis, and discussion) poster of the paper as an alternative. Moreover, in addition to creating this IMRAD poster, the students performed a poster walk where they peer-reviewed their colleagues’ posters using a grading matrix in the form of an online survey.
I have been teaching Scientific and Academic English writing courses and elements of scientific writing since 2002, mostly in the Department of Engineering and IT at the Carinthia University of Applied Sciences in Austria. My students for the most part are native German speakers, with a few exceptions over the years, and the English courses in their curriculum are meant to prepare them for their future jobs as engineers and IT specialists as well as to give them tools to write their bachelor works or master theses. Our bachelor students are taught to write their final papers using the so-called IMRAD format: Introduction, Methods, Results, and Discussion. Tied in with teaching IMRAD is a review of scientific journal papers, mostly from IEEE journals, so that students learn how to carry out literature reviews in preparation for their final bachelor project and accompanying bachelor work.
In a cross-curricular learning environment, my more technical colleagues (professors and lecturers of electrical engineering, software development and programming, specialists in multi-media development and applications, etc.) provide me with journal articles related to the students’ field of studies. Students review the papers and then select one to write a one-to-two page summary for my English course and then the students present the paper in a timed 5-minute presentation in English with two minutes for Q and A in front of myself, the language instructor, and my colleague, the subject matter expert. This method worked very well over the years as the students could identify with the task as it met their critical immediate needs of preparing for the bachelor project, writing their bachelor works based on this project, and then presenting their bachelor works during their final exam. Key skills such as reading comprehension, paraphrasing, and summarizing, as well as correct paper formatting using the IEEE writing style and reference guide (IEEE Author Center Journals, n.d.), were the goals behind this exercise.
With the advent of AI-tools ranging from ChatGPT to Google’s Notebook LM, the task of reading and summarizing a ten-page scientific journal has gone from a number of hours to a few seconds. Thus, the process of understanding the IMRAD structure and how the authors pose the research question, describe the used methodology, present the results, and explain the significance of their results is greatly diminished if not entirely lost. AI-tools can bring about amazing increases in efficiency for scientists, professors, and those with experience to critically analyze the AI-generated results; for students and learners, however, the outcome may be ‘blind acceptance’ of the data the AI-tool generates, as they do not possess the necessary skills to critically question these results. As a lecturer, I did not want to grade summary papers while continually trying to walk the fine line of which AI-tools are allowed and to what extent can the AI-tool be applied. Thus, I dropped the written summary portion of the paper and replaced it with a research poster presentation in the form of a mock scientific conference poster walk in the 2025 Summer Semester.
My students were pursuing Bachelor of Science in Information Technologies degrees with eight specializing in Multimedia Technology and two specializing in Geoinformation and the Environment. They were in the 4th semester of their studies, and in the 5th semester, they would complete their bachelor project, and the in 6th and final semester, they would write their respective bachelor works and have their final exams, which include a presentation of their bachelor works. Thus, a keystone of ESP - relevancy and immediate use - are present as motivators for the students.
The task began as usual, with colleagues providing me scientific papers that correspond with the students’ specializations. I placed these files in our learning management system Moodle course so the students could download the papers and then choose which paper they would like to present and design a poster for. The exact workflow for the paper selection and preparation of the presentation is shown in Figure 1. Note the academic handout was replaced with an academic poster and accompanying scientific conference poster walk and the IMRAD process, which had been discussed in previous lectures and is reinforced in the instructions. Steps 1-6 are all completed in the corresponding Moodle course.
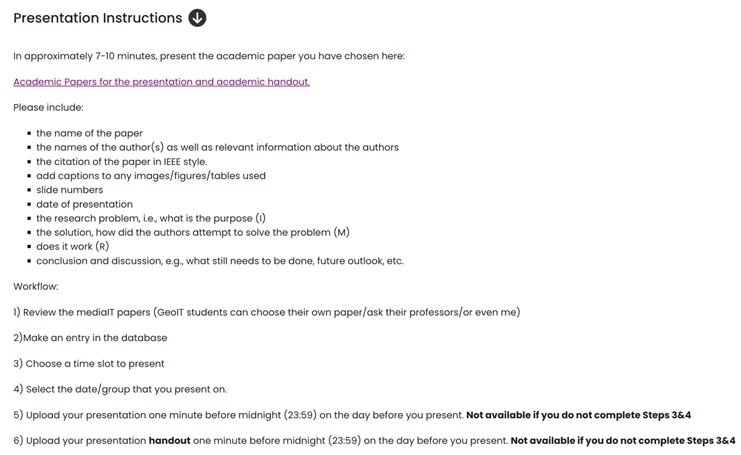
Figure 1: Presentation instructions screenshot
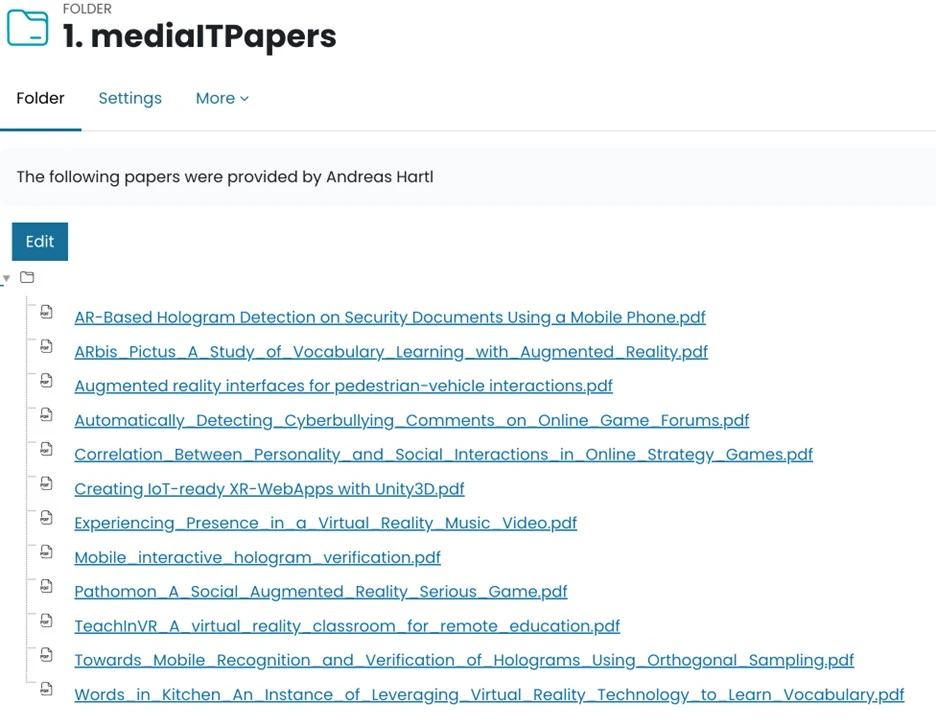
Figure 2: List of mediaIT papers provided by Dr. A. Hartl, Carinthia Univ. of Applied Sciences
The idea for a research poster and a scientific conference poster walk was inspired by my own experiences presenting posters at TESOL conventions as well as at my university. Students were provided with various examples and templates as well as a lecture on how to design a ‘viewer-friendly research poster” (Carnegie Mellon University, n.d.). Students then were allowed to use the software program of their choice (most used Microsoft PowerPoint or Canva) and the design of their choice. After all submissions were collected, I printed out the posters in A3 format (210mm x 297mm) and hung them up in a lecture room and then asked the students to evaluate each other’s poster as well as their own.
For this evaluation, I prompted Perplexity AI to create a survey to evaluate a research poster based on content, and design. Perplexity returned a survey with several questions which I then reduced to 16 total and adapted them into these four categories: basics (4), design (5), content (4) and visuals (3). A movable scale, a so-called slider, between 1 (lowest) to 5 (highest) was used to allow ease of use on mobile devices and so an overall rating for each poster could be calculated (Fig. 4). Additionally, I created a QR-code so that students could easily access the online survey on their mobile devices. Students evaluated 10 posters and I was quite impressed on how serious they performed this task both in the time taken for the evaluation which was approximately 6-7 minutes per poster and for the evaluation scores as well. Scores ranged from 55% to 91% with the average score of 81%.
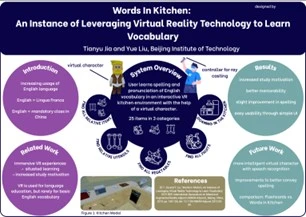
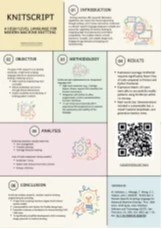
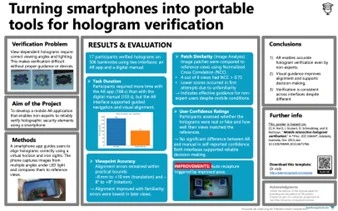
Figure 3: Students posters reproduced with permission of the students. All identifying features have been removed.
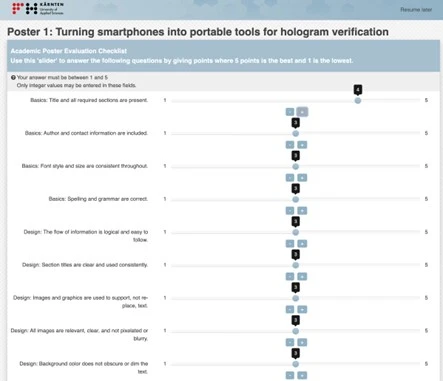
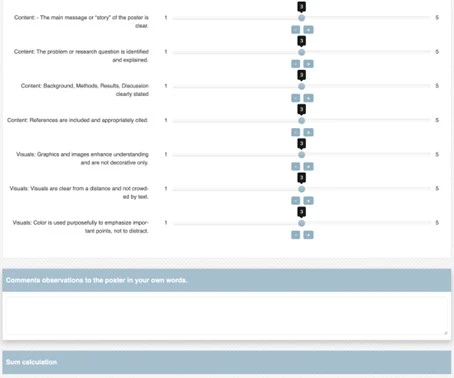
Figure 4: Online peer review research poster evaluation
In conclusion, I feel that moving away from a written summary to a research poster format to introduce IMRAD and to analyze academic papers worked very well. The poster walk and the online peer evaluation reinforced the IMRAD concept, and this was reflected in the individual content questions results which ranged from approximately 3.5 to 4.6 from a total of 5. Moreover, this activity was well-received by the students and was much more interactive through the peer review aspect. From the instructor’s point of view, I would say that I put effort into the preparation and development of the task itself as well as printing out the posters and setting up the survey. However, this activity eliminated the need of correcting paper summaries, which in many ways AI-tools had made redundant. Additionally, I was able to use the peer review calculations that were generated by the program Lime Survey to assist me in the grading of the posters. I will be presenting this activity at TESOL 2026 in Salt Lake City and will be available for discussions during the conference.
References
Carnegie Mellon University. (n.d.). Research poster visual design – Student Academic Success Center. Retrieved February 8, 2026, from https://www.cmu.edu/student-success/other-resources/resource-descriptions/science-research-posters.html
IEEE Author Center Journals. (n.d.). IEEE editorial style manual. Retrieved February 8, 2026, from https://journals.ieeeauthorcenter.ieee.org/your-role-in-article-production/ieee-editorial-style-manual/
 Marvin D. Hoffland is a Senior Lecturer of English at the Carinthia University of Applied Sciences in Klagenfurt, Austria. He teaches ESP/EFL courses in the areas of Business, Medical and Technical English. His degrees include an MS in Economics and a BA in German and Economics.